File:1935 housing map.jpg
Original file (1,478 × 613 pixels, file size: 232 KB, MIME type: image/jpeg)
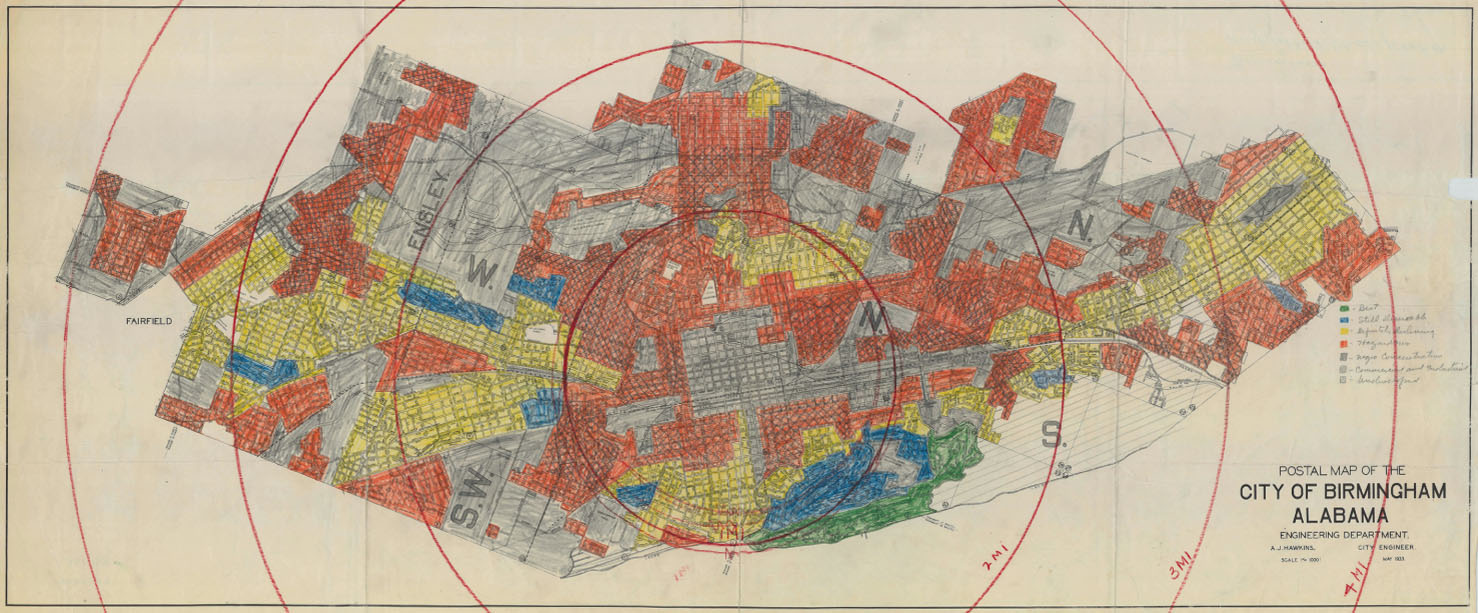
1935 housing map of Birmingham. The base map was drawn in May 1933 by A. J. Hawkins, city engineer and the Birmingham Engineering Department for submission to the Federal Home Loan Bank Board's Home Owners' Loan Corporation.
The map is one of a series of select cities which were annotated to indicate risk levels for residential mortgage loans based on the type of district (residential, commercial, industrial) and the income level in residential neighborhoods (low income, middle income, high income). Birmingham's map also indicates which neighborhoods are "Definitely Declining" and whether a neighborhood has a "Negro Concentration". These types of maps are generally referred to as "redlining maps" because they were used to reject federal mortgage loans to areas where African Americans could buy homes.
The Birmingham map's hand-colored areas are described in the legend as follows:
- Green - "Best"
- Blue - "Still Desirable"
- Yellow - "Definitely Declining"
- Red - "Hazardous"
- Gray - "Negro Concentration"
- Gray crosshatched - "Commercial & Industrial"
- Gray single-hatched - "Undeveloped"
In fact, the colorist seems not to have distinguished areas with "Negro Concentration" with those which were "Commercial & Industrial", coloring both in solid gray.
The circles show the distance from the city center to the furthest outposts of the city limits.
References
- Downing, Jared (June 30, 2015) "Old Birmingham map outlined 'Negro Concentrations,' then shunned them" The Birmingham News
External link
- "Redline Map for Birmingham, Alabama" at the National Archives
File history
Click on a date/time to view the file as it appeared at that time.
| Date/Time | Thumbnail | Dimensions | User | Comment | |
|---|---|---|---|---|---|
| current | 17:18, 8 June 2014 | | 1,478 × 613 (232 KB) | Dystopos (talk | contribs) | 1935 housing map of Birmingham. The base map was drawn in May 1933 by A. J. Hawkins of the Birmingham Engineering Department The hand-colored areas are described in the legend a |
You cannot overwrite this file.
File usage
The following 2 pages use this file: