File:1935 housing map.jpg
Jump to navigation
Jump to search
Size of this preview: 800 × 332 pixels. Other resolution: 1,478 × 613 pixels.
Original file (1,478 × 613 pixels, file size: 232 KB, MIME type: image/jpeg)
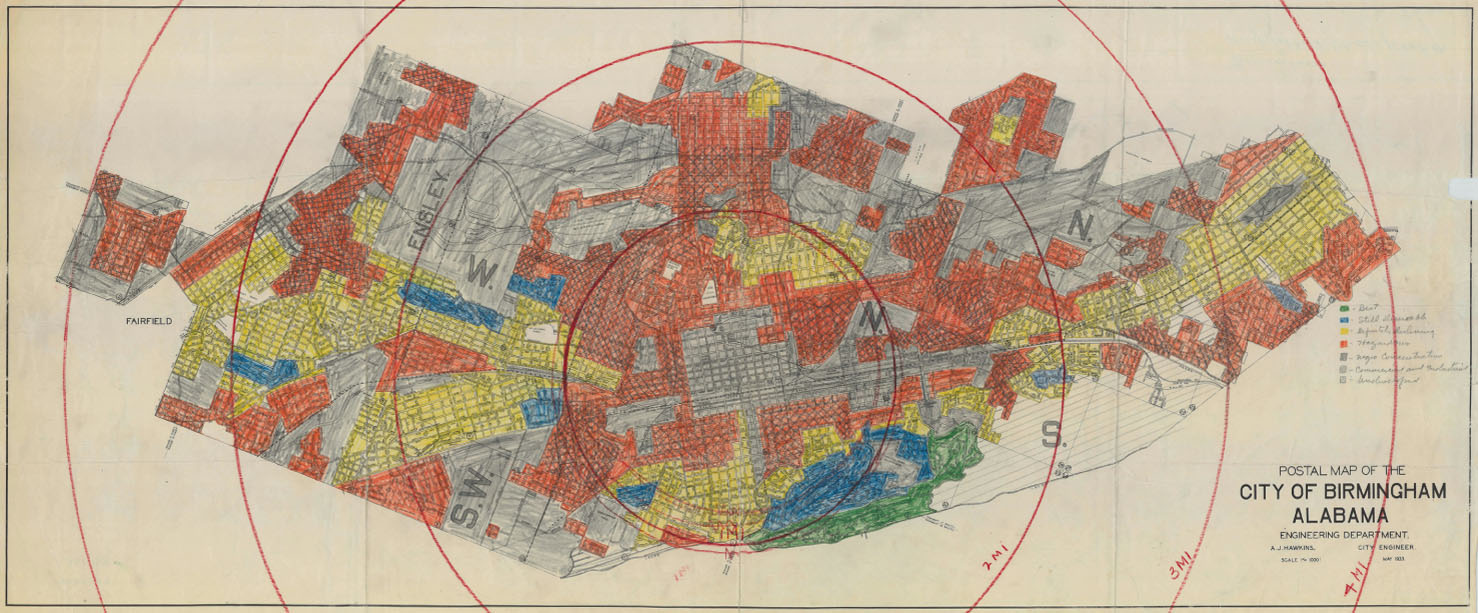
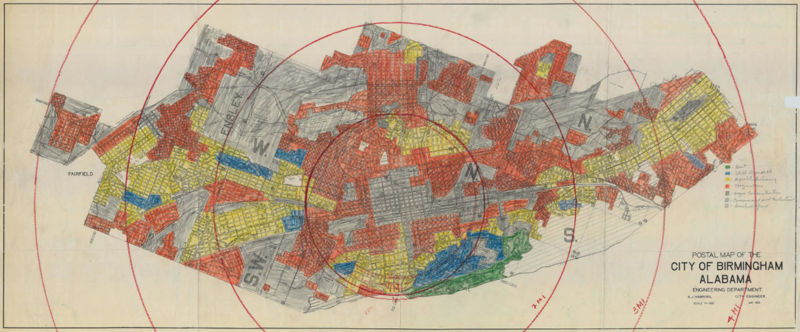
1935 housing map of Birmingham. The base map was drawn in May 1933 by A. J. Hawkins of the Birmingham Engineering Department
The hand-colored areas are described in the legend as follows:
- Green - "Best"
- Blue - "Still Desirable"
- Yellow - "Definitely Declining"
- Red - "Hazardous"
- Gray - "Negro Concentration"
- Gray crosshatched - "Commercial & Industrial"
- Gray single-hatched - "Undeveloped"
In fact, the colorist seems not to have distinguished areas with "Negro Concentration" with those which were "Commercial & Industrial", coloring both in solid gray.
The circles show the distance from the city center to the furthest outposts of the city limits.
File history
Click on a date/time to view the file as it appeared at that time.
| Date/Time | Thumbnail | Dimensions | User | Comment | |
|---|---|---|---|---|---|
| current | 17:18, 8 June 2014 | | 1,478 × 613 (232 KB) | Dystopos (talk | contribs) | 1935 housing map of Birmingham. The base map was drawn in May 1933 by A. J. Hawkins of the Birmingham Engineering Department The hand-colored areas are described in the legend a |
You cannot overwrite this file.
File usage
The following 2 pages use this file: